Blogs
Latest Air Quality Reads
Quick guides and simple explainers for understanding pollution, AQI, and cleaner daily habits.
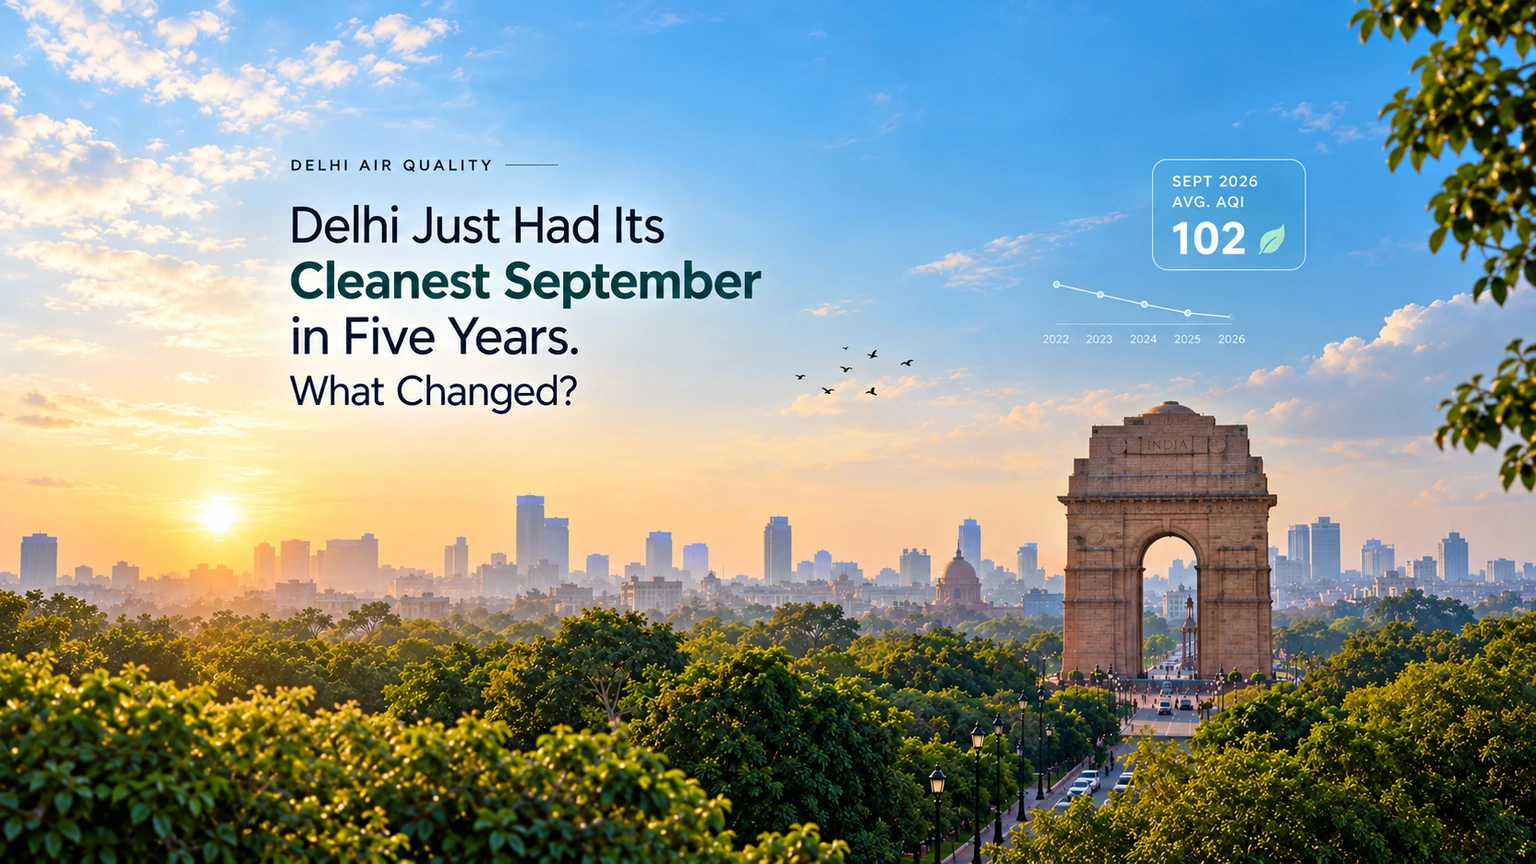
Delhi Just Had Its Cleanest September in Five Years. What Changed?
Delhi's air just did something unexpected. September was its cleanest in five years – even as the monsoon was leaving and the city moved closer to its notorious pollution season.
Read article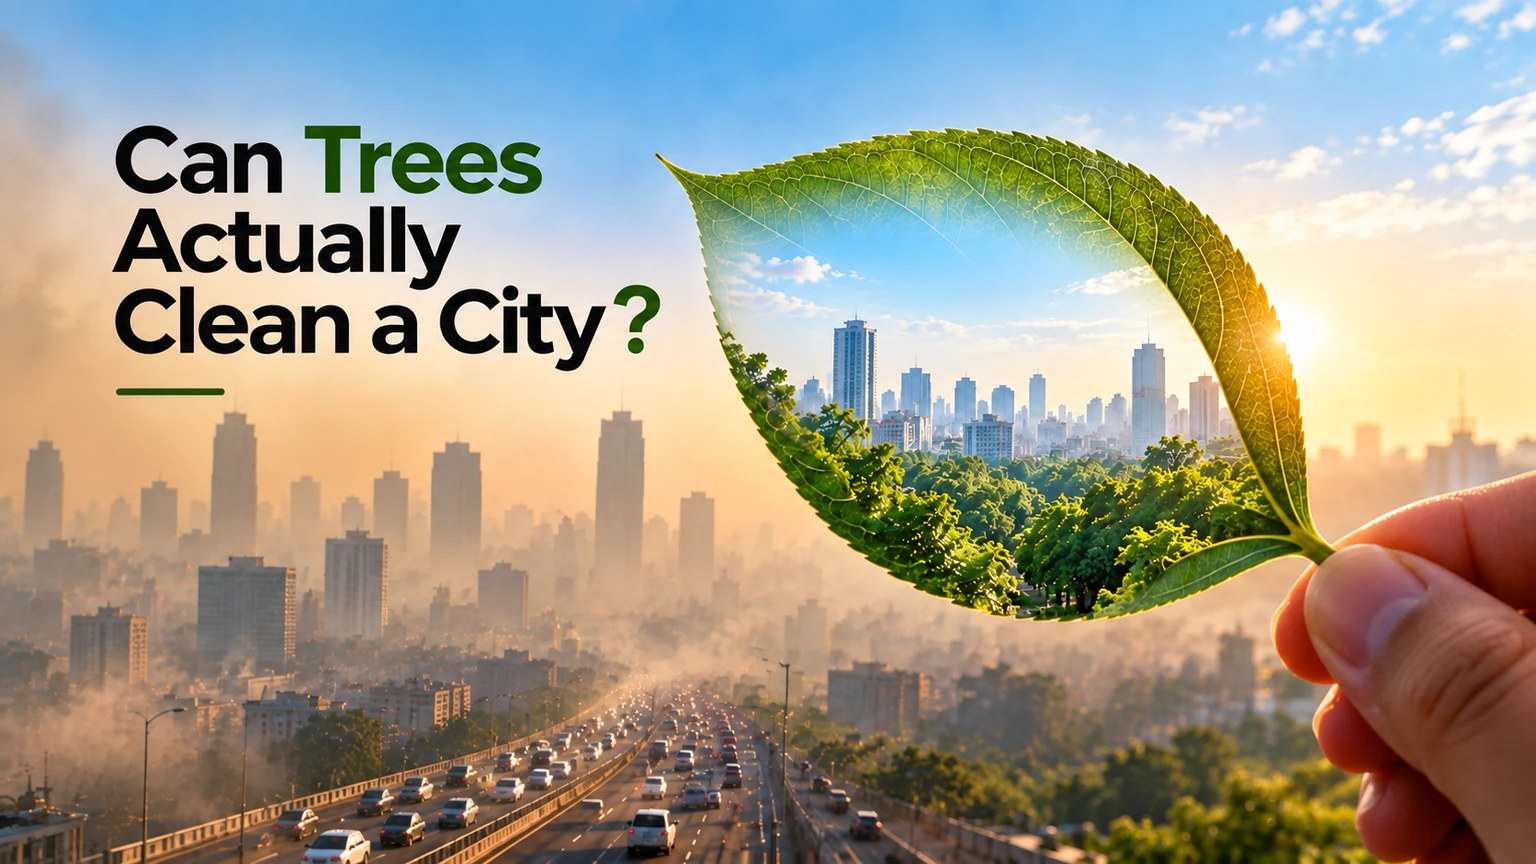
Can Trees Actually Clean a City?
When a city struggles with air pollution, one solution appears almost immediately: plant more trees. Trees can help improve urban air quality – but they cannot compensate for unlimited pollution emissions.
Read article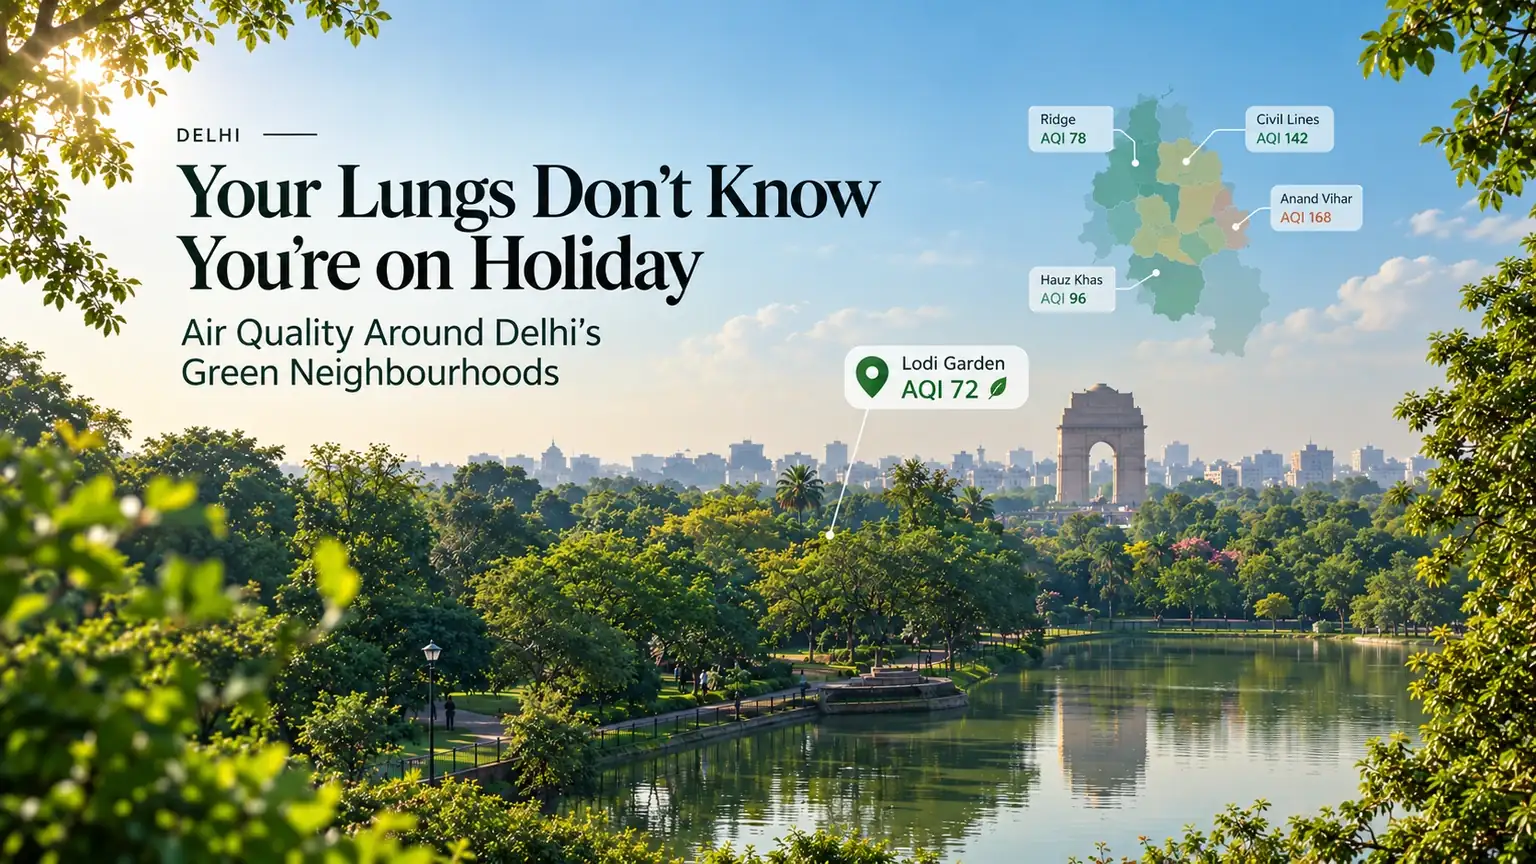
Your Lungs Don't Know You're on Holiday: Air Quality Around Delhi's Green Neighbourhoods
Ask a Delhiite where the air is best in the city and you'll get a predictable answer: Lutyens Delhi, the Ridge, the areas near the Yamuna Biodiversity Park. The instinct isn't wrong. But the reasons are more interesting than "more trees = cleaner air."
Read article
The Indoor Air Trap: Why Your Home in Mumbai or Bangalore Might Be More Polluted Than Outside
The instinct makes sense: when the AQI climbs, you stay inside and close the windows. But for many Indian homes, closing the windows doesn't mean breathing clean air – it can mean breathing concentrated indoor air that is worse.
Read article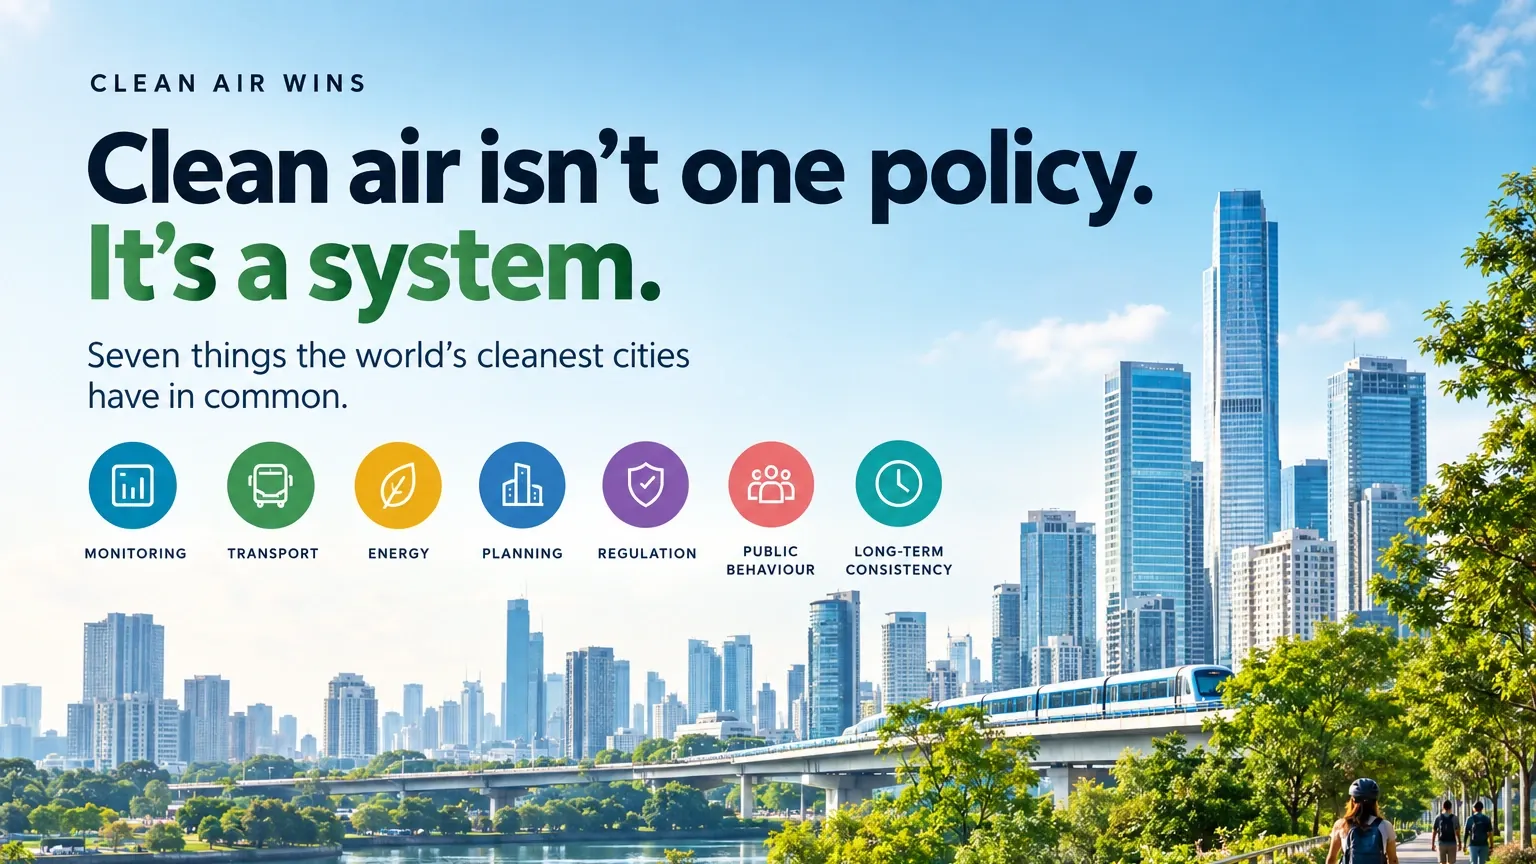
Seven Things the World's Cleanest Cities Have in Common
There is a tempting way to think about air pollution: a city is polluted because it has too many cars, too many factories or too many people. Reality is much more interesting - cleaner cities almost never rely on a single fix.
Read article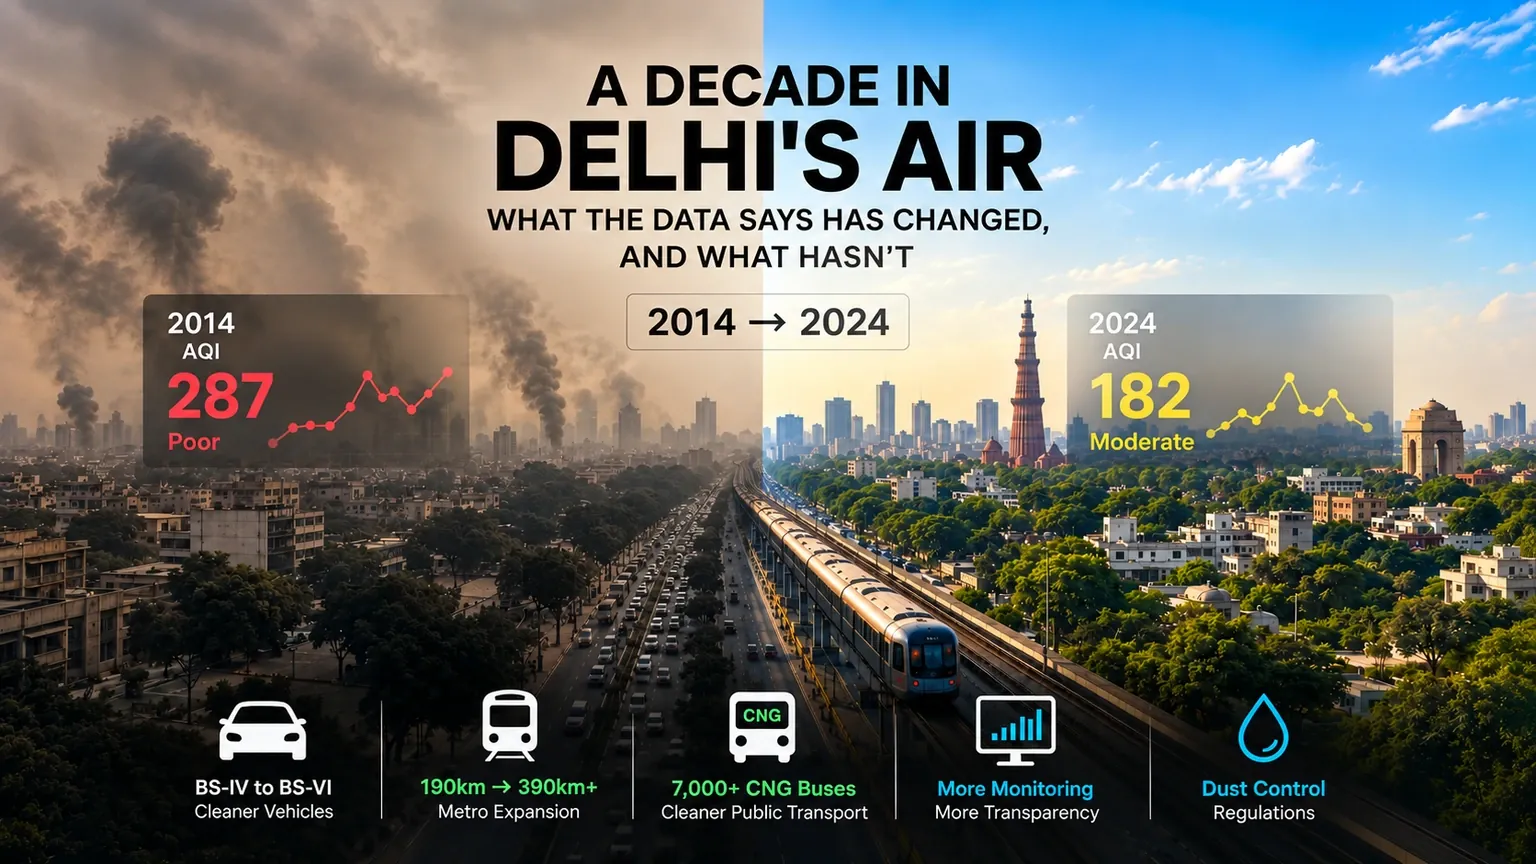
A Decade in Delhi's Air: What the Data Says Has Changed, and What Hasn't
Every winter, the headlines say the same thing: Delhi's air is at crisis levels, the worst in years, unprecedented pollution, no end in sight. Every summer, the crisis recedes from memory. Repeat.
Read article
How India's Clean Energy Push Is Quietly Changing the Air
India added more solar capacity in the last five years than most European countries have in total. This is not a minor footnote in the global clean energy story. And its relationship to air quality, while complicated, is one of the most important long-term trends in the country's environmental trajectory.
Read article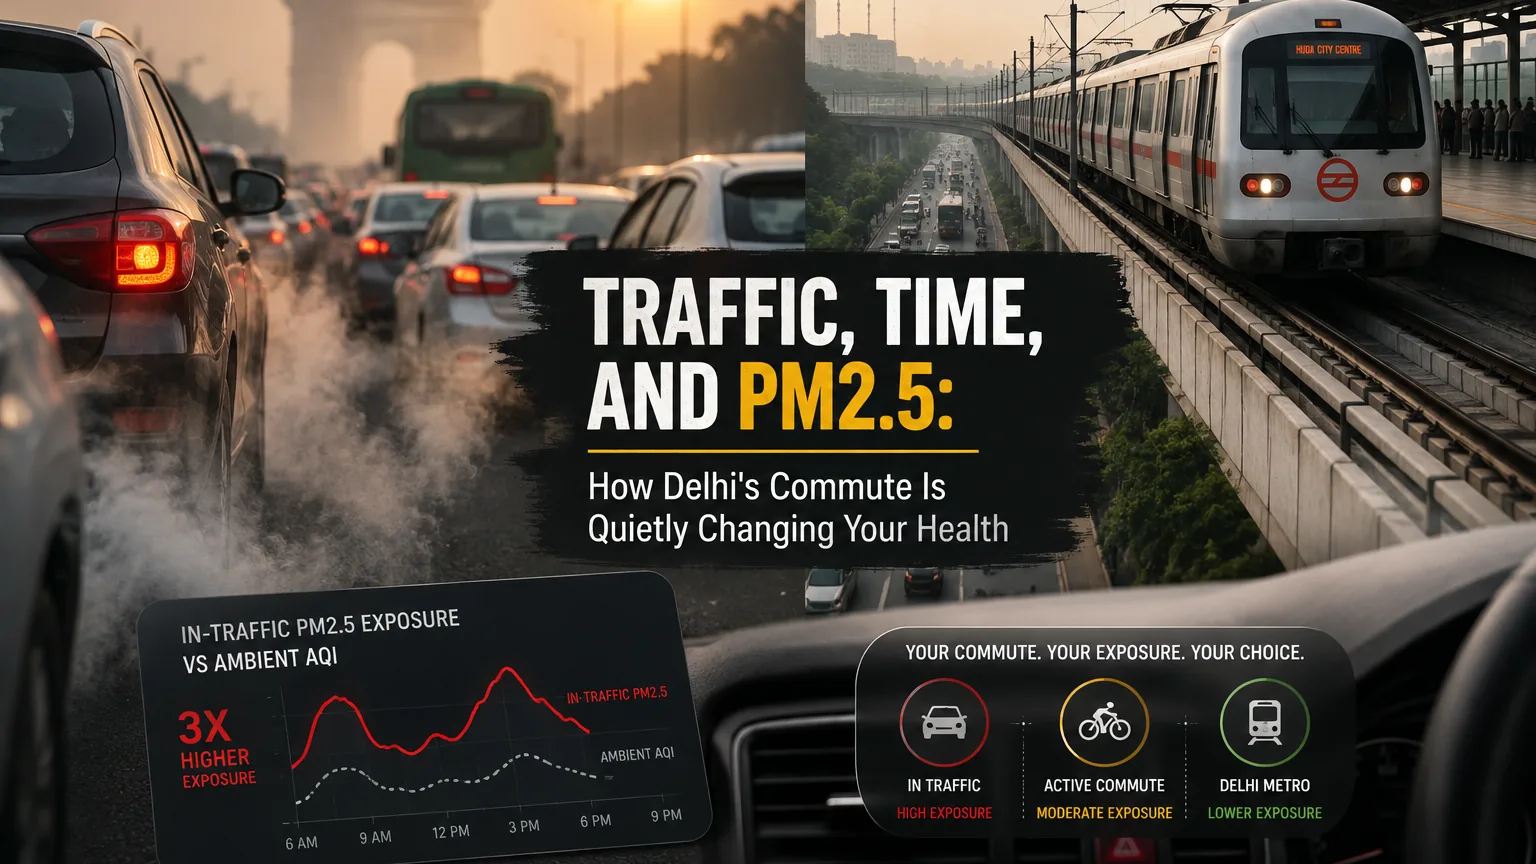
Traffic, Time, and PM2.5: How Delhi's Commute Is Quietly Changing Your Health
You've checked the Delhi AQI today. It says 180 — "Unhealthy." You figure it's manageable. You get in your car or hop on a bus and navigate the morning gridlock. What you probably don't know is that your actual PM2.5 exposure during those 45 minutes in traffic was likely 2 to 3 times higher than what the monitoring station reported.
Read article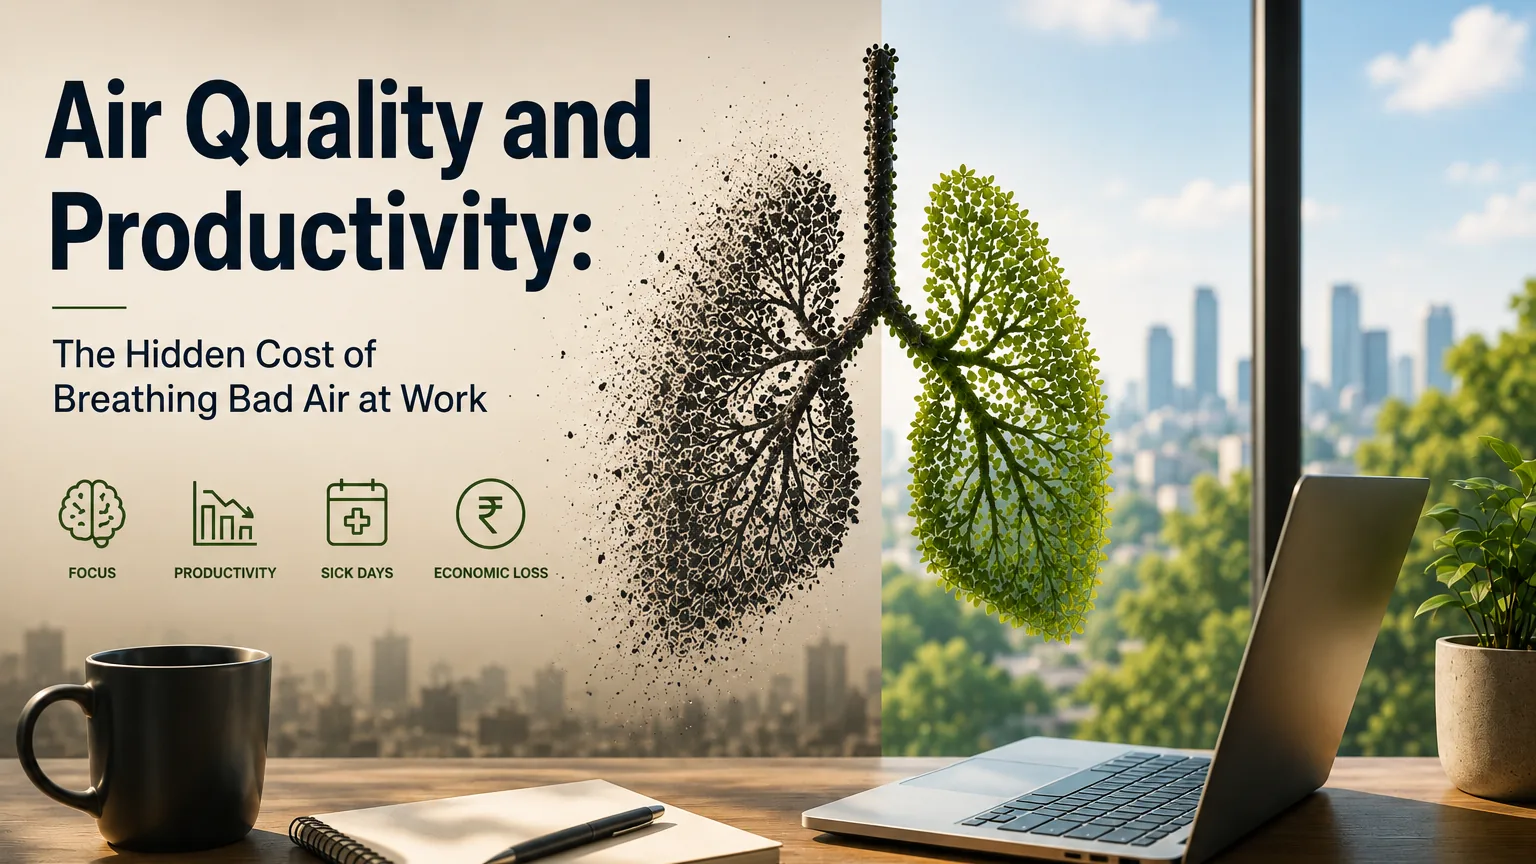
Air Quality and Productivity: The Hidden Cost of Breathing Bad Air at Work
You've probably blamed a slow workday on bad sleep, too much coffee, or the quarterly review looming on your calendar. But there's another variable almost no one factors in — the air you're breathing right now.
Read article
The Air Your Children Are Breathing: What Parents in Indian Cities Need to Know
Children breathe roughly 50% more air per kilogram of body weight than adults, and their lungs are still forming. In a city where the AQI regularly crosses 200, that is a daily calculation every parent is making — whether they realize it or not.
Read article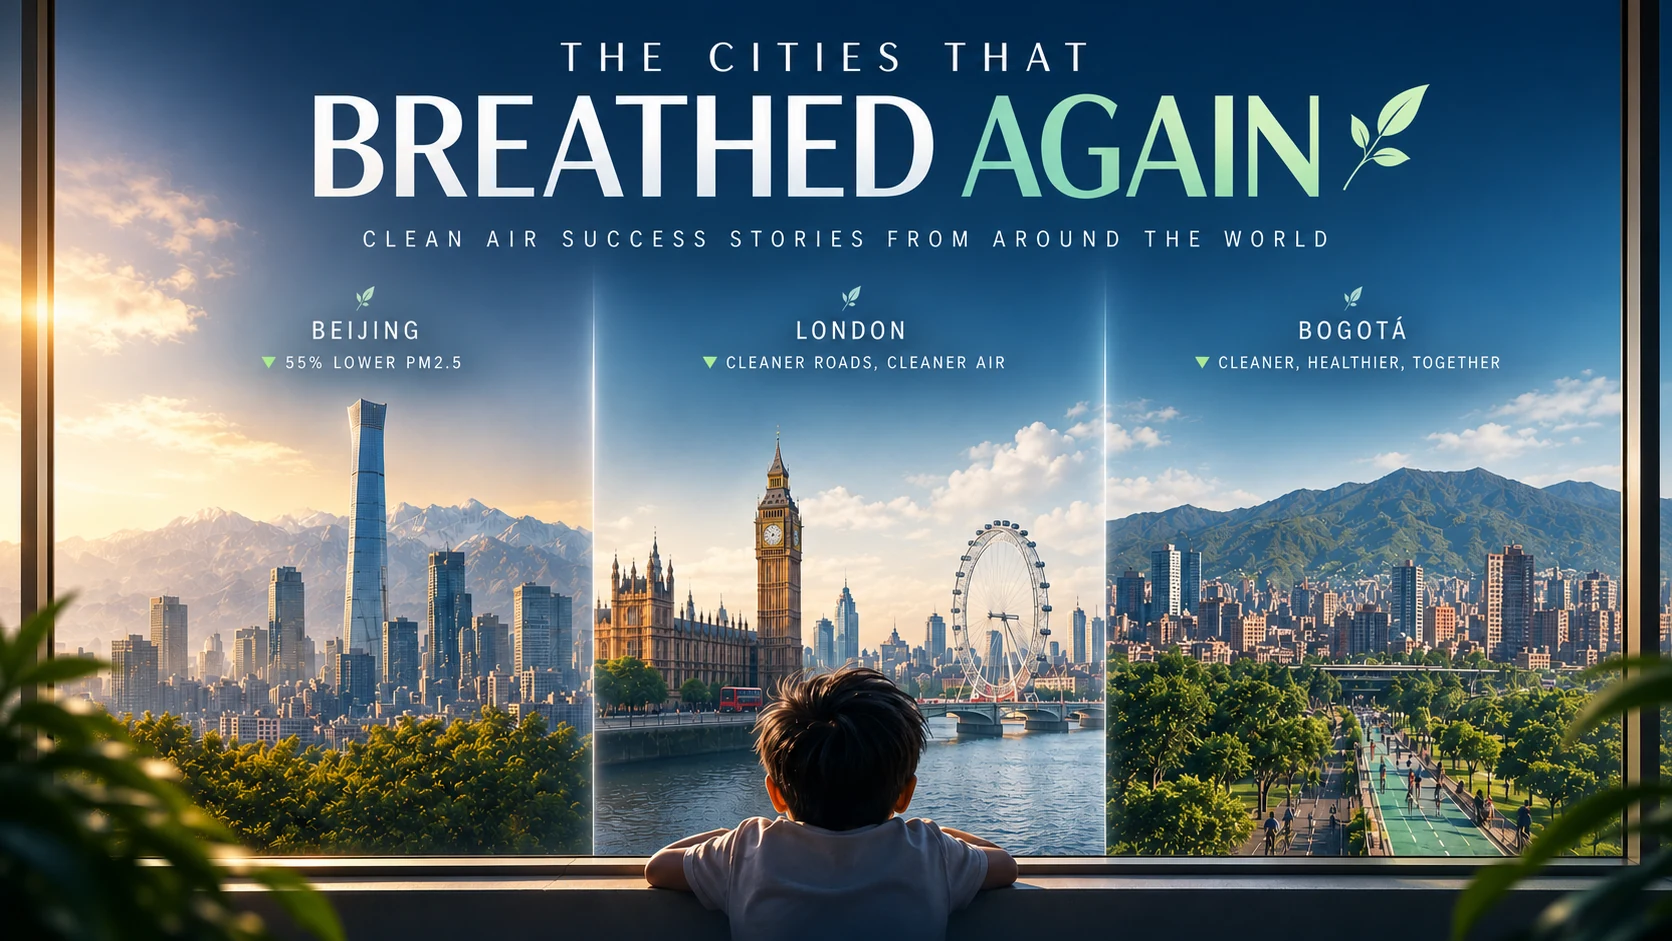
The Cities That Breathed Again: Clean Air Success Stories From Around the World
Ten years ago, you couldn't see the mountains from Beijing's city center. Today, on many days, you can. That's not a metaphor. It's measured, documented, and replicable. It's one of the most under-told environmental stories of our time.
Read article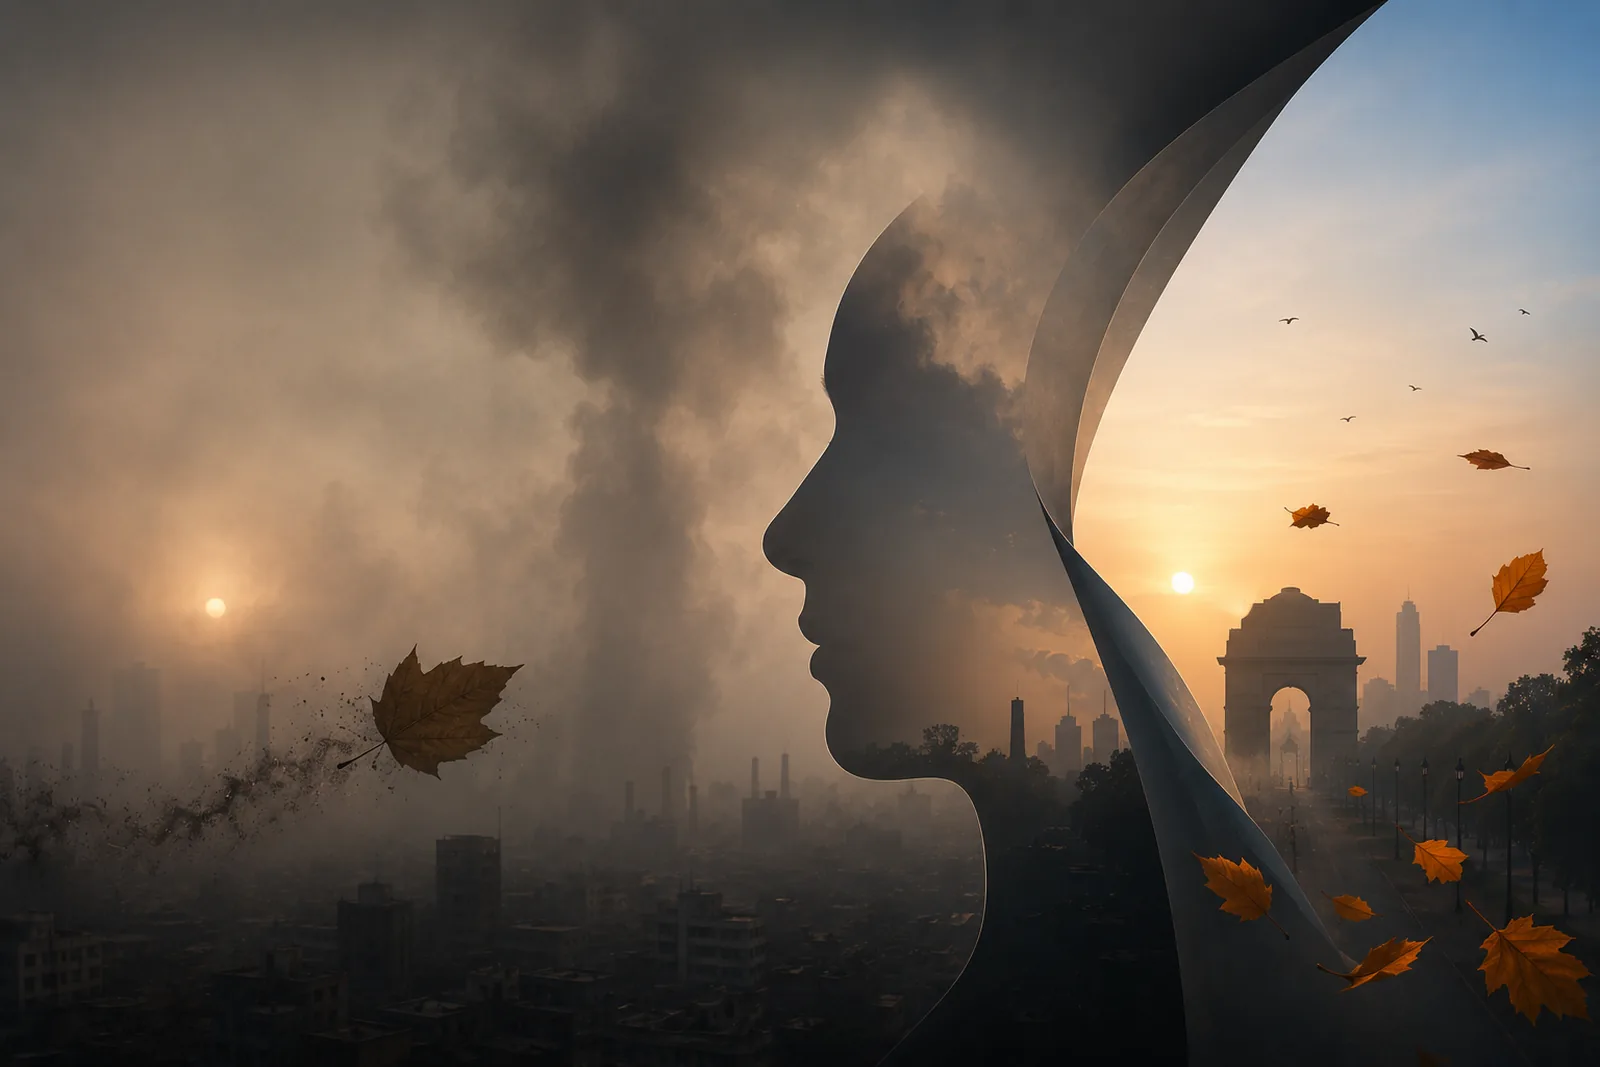
Delhi's Invisible Winter: What Really Happens to the Air Between October and February
Every October, like a slow-motion alarm clock, Delhi's air begins its winter deterioration. The city hasn't changed overnight. The factories haven't multiplied. The cars haven't doubled. But the AQI starts climbing – 100, 150, 200 – and by November, on the worst days, the numbers scroll past 400 while the sky turns the colour of weak tea. What's happening? The honest answer is more complicated than the stubble burning debate suggests.
Read article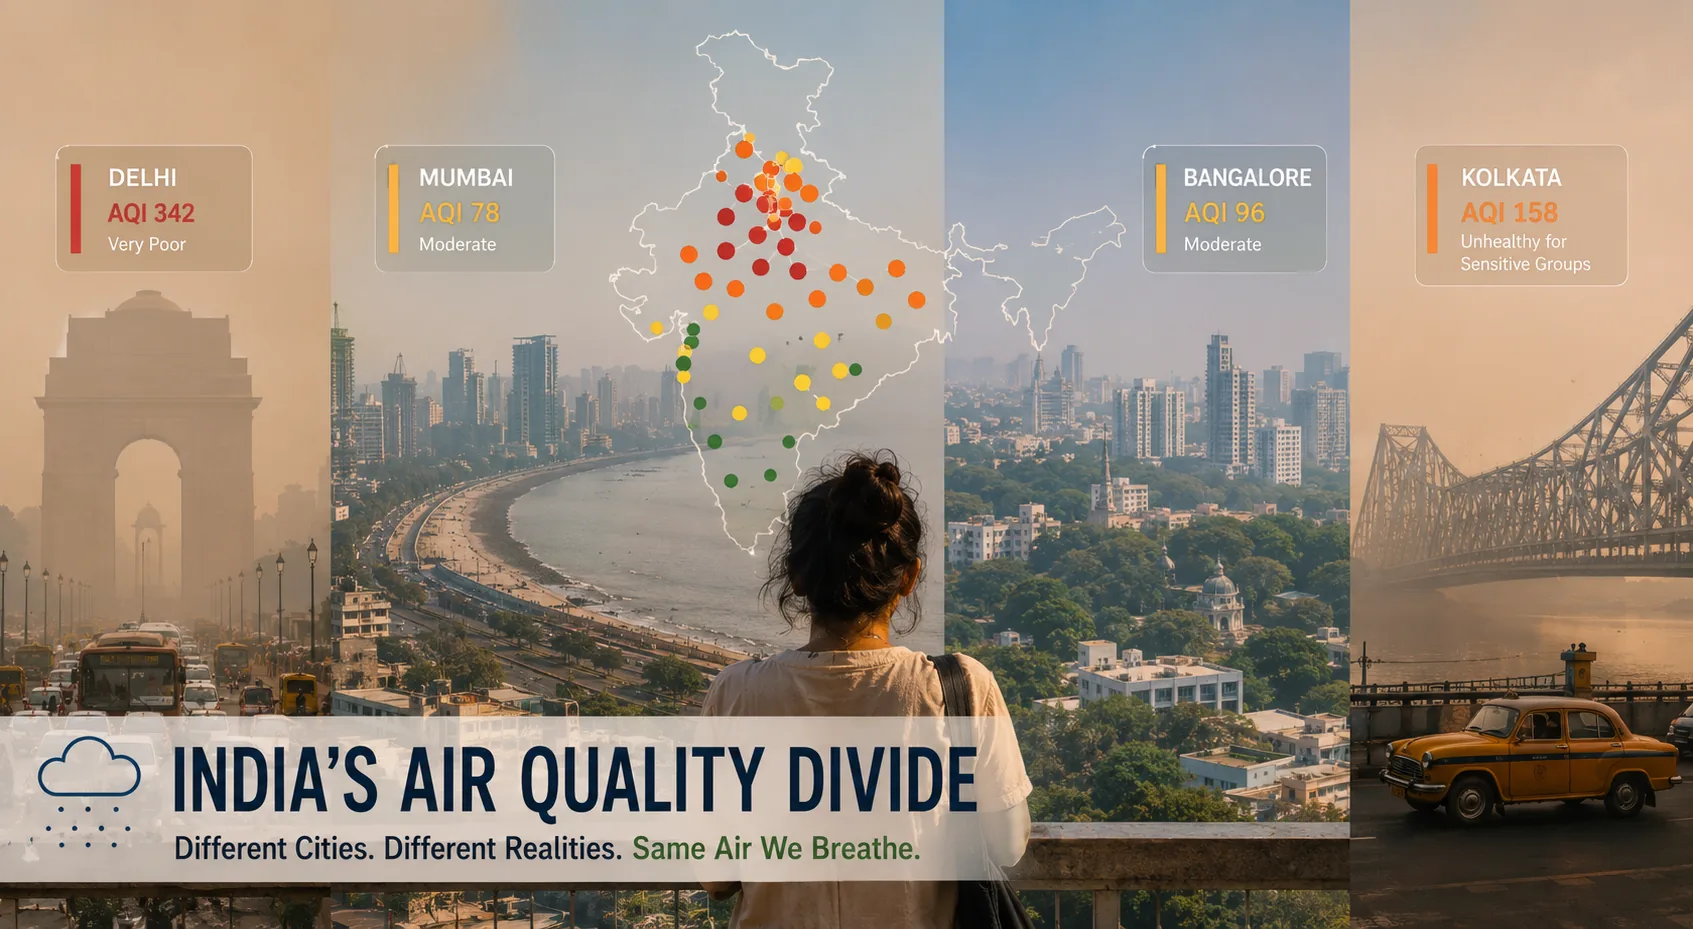
India's Air Quality Divide: Why Mumbai, Bangalore, and Kolkata Experience Pollution So Differently
Mention "India and air pollution" and most people picture Delhi. That framing is both understandable and incomplete. India is a continent masquerading as a country, and its air quality story is fractured, regional, and shaped by factors as different as monsoon geography and industrial legacy.
Read article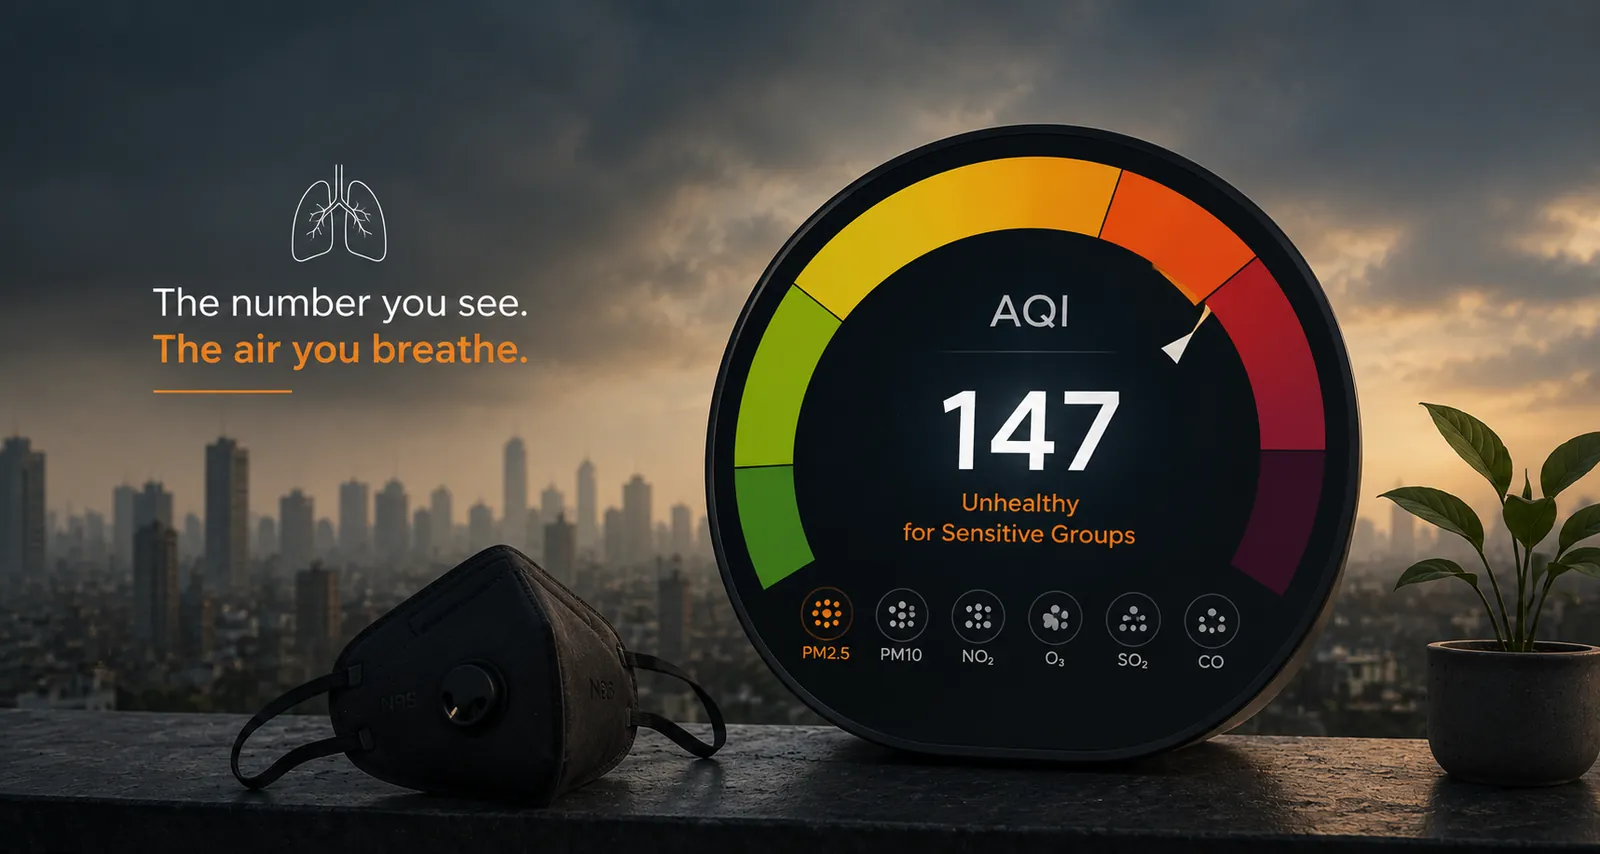
The AQI Number You've Been Misreading (And What It Actually Means for Your Body)
You've seen the number — 147, 312, 78 — on a weather app or a headline about Delhi. But do you actually know what it means for what's happening inside your lungs right now? Most people don't, and it's not their fault.
Read article