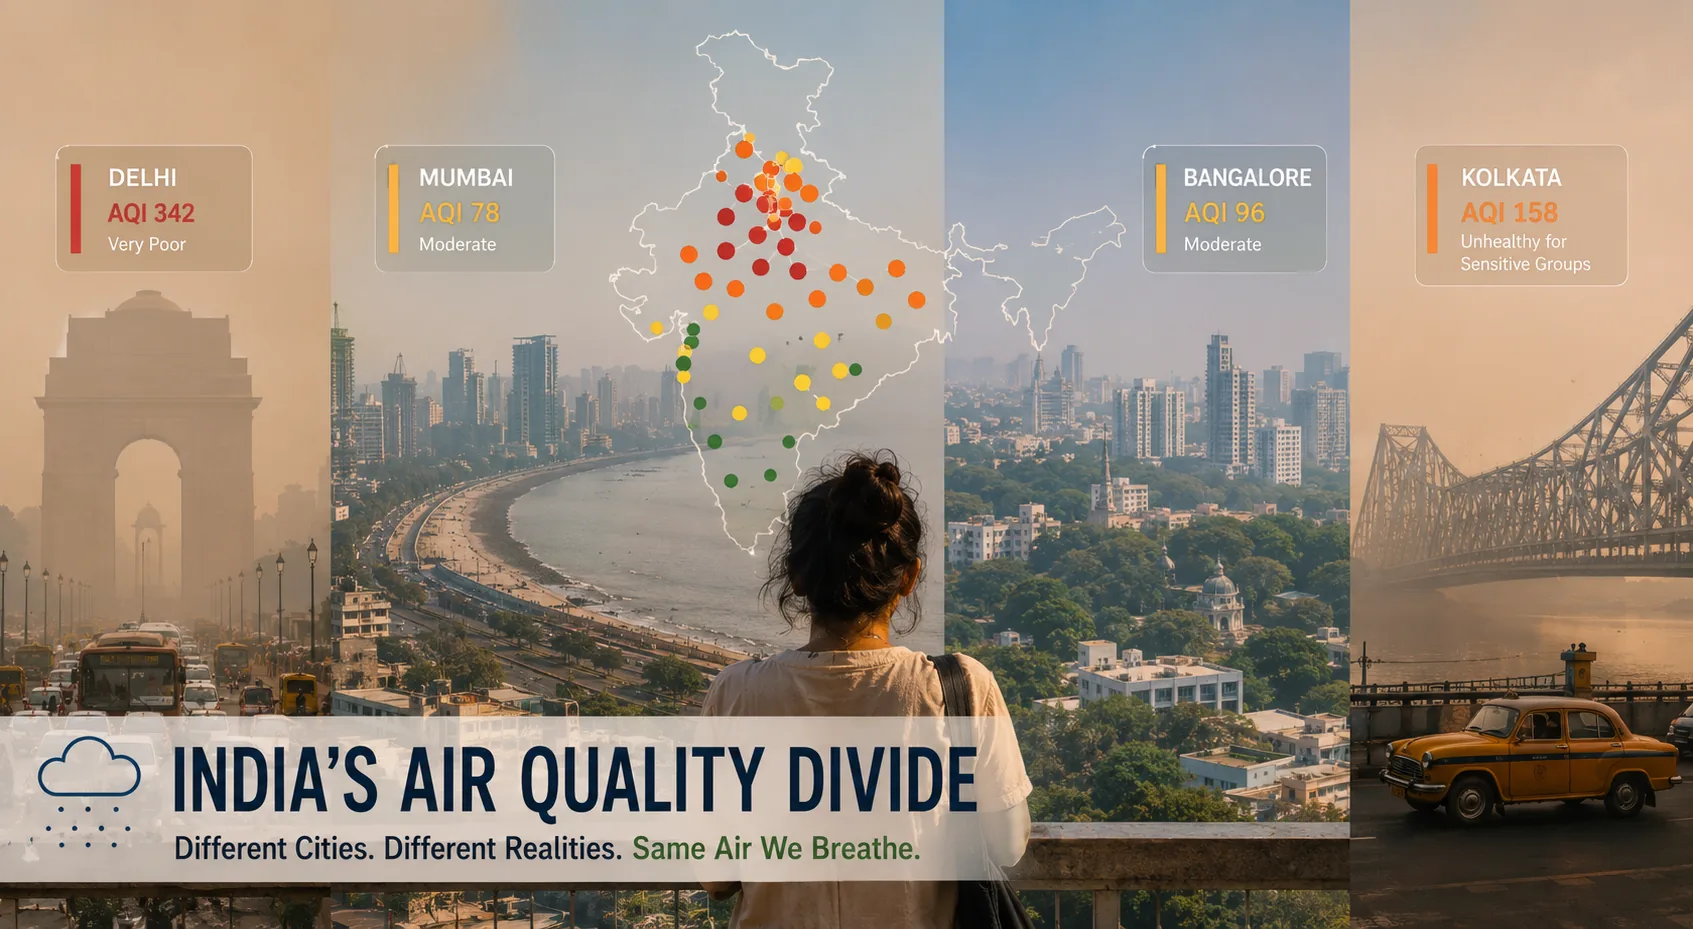
Mention "India and air pollution" and most people picture Delhi. That framing is both understandable and incomplete. India is a continent masquerading as a country, and its air quality story is fractured, regional, and shaped by factors as different as monsoon geography and industrial legacy.
India is home to many of the world's most polluted cities. It also contains cities that regularly clock AQI readings that would be considered acceptable in Europe. Understanding why requires looking past the headlines and into the specific drivers – geography, industry, meteorology, urban density – that shape each city's air.
Delhi NCR: The Most Studied, Still the Most Challenged
Delhi is the anchor of India's air quality conversation for a reason. The combination of vehicular density (over 11 million registered vehicles in Delhi alone), proximity to stubble-burning agricultural regions in Punjab and Haryana, topographic trapping due to the Indo-Gangetic Plain's wind patterns, and construction activity creates a near-perfect storm for particulate accumulation.
Winter months – October through January – are when Delhi's air turns from a chronic problem into an acute crisis. The meteorological condition called inversion, where a layer of warmer air traps cool polluted air near the ground, essentially puts a lid on the city and concentrates everything produced locally plus what drifts in from hundreds of kilometres away.
The numbers in this period routinely exceed 300 AQI. On the worst days, the 500 ceiling of the standard AQI scale can feel like an understatement.
Lucknow and Kanpur: The Unsung Gangetic Belt Cities
If Delhi dominates the news, cities like Lucknow, Kanpur, and Varanasi often escape attention despite facing comparable or worse conditions for portions of the year. These cities sit in the same Indo-Gangetic Plain as Delhi, face the same inversion–driven trapping, but have less industrial monitoring infrastructure and weaker enforcement capacity.
Kanpur, in particular, has historically ranked among the most polluted cities in the world in several international air quality reports – not because it is uniquely industrial, but because the combination of tanneries, vehicular emissions, and the Gangetic meteorology creates conditions that rarely get scrutinised the way Delhi's do.
Mumbai: The Sea Breeze Advantage (and Its Limits)
Mumbai's air quality is genuinely better than Delhi's for most of the year, and the primary reason is geography. The Arabian Sea creates persistent sea breezes that disperse pollutants before they accumulate to Delhi-like concentrations.
But Mumbai is not clean. The city has serious issues with vehicular and industrial emissions, particularly in areas like Chembur and Malad that host industrial clusters. During Diwali and in the pre-monsoon months when sea breeze patterns weaken, Mumbai's AQI can jump to levels that would generate headlines if they occurred in Delhi.
Mumbai's air quality also has a profound inequality dimension: residents of areas close to industrial zones or major arterial roads breathe air that is measurably worse than those in coastal or elevated neighbourhoods. The Marine Drive experience and the Dharavi experience are not the same atmosphere.
Bangalore: The Altitude Myth
Bangalore is often described as a city of pleasant weather and clean air. This reputation is partly deserved – at 900+ metres elevation, the city has better baseline dispersion conditions than low-lying plains cities – but it is being eroded quickly.
Bangalore's AQI has been trending upward for a decade, driven primarily by a vehicle density explosion (the city adds hundreds of thousands of new vehicles annually), construction dust from its perpetual infrastructure boom, and a significant reduction in its tree canopy as tech campuses and apartment complexes replace the green corridors that once helped absorb pollutants.
On a bad construction season day, parts of northern Bangalore can register AQI readings in the unhealthy range. The pleasant weather narrative is real, but increasingly precarious.
Chennai: The Underreported Story
Chennai has a relatively active pollution monitoring network for its size, yet air quality data from the city rarely enters national discourse. The city faces specific challenges from two-wheeler density (Tamil Nadu has among the highest two-wheeler penetrations in India), thermal power plants on its outskirts, and port-adjacent industrial activity.
Chennai's AQI is generally moderate – better than the Gangetic belt, but worse than many assume given the city's coastal location. The monsoon, which brings heavy rainfall, provides a significant seasonal reprieve. October through January, however, sees rising particulate levels.
Ahmedabad: Industry, Heat, and Wind
Gujarat's largest city has a different pollution profile from either the Gangetic belt or coastal metros. Ahmedabad's air quality challenges are tied significantly to its industrial base – chemicals, textiles, pharmaceuticals – and to the dust events driven by its semi-arid climate.
The city's wind patterns can both help and hurt: on high-wind days, pollutants disperse efficiently; on still, humid days, the city can see rapid AQI deterioration. Ahmedabad's summer months, when temperatures regularly exceed 40°C and construction activity peaks, are often its worst for air quality.
The Data Point That Changes Everything
Here is a number worth sitting with: India is home to more than 40 of the 50 most air-polluted cities in the world by PM2.5 annual average, according to global air quality databases. But the variation within India is enormous – from cities exceeding 100 µg/m³ annually to cities with readings closer to 25-30 µg/m³.
That gap is not fate. It's the product of geography, policy, enforcement, and infrastructure. Which means it's closeable.
The first step is knowing where you are, right now, on the dashboard.
Put two cities side by side to see how their current AQI and pollutant conditions differ – useful for travel, relocation, or simply understanding the regional gap.
Compare City AQI Now