Your city has an AQI number. But that number might not tell the whole story of the air you breathe.
Imagine checking the air quality before leaving home.
The map shows your city in yellow. The air quality is moderate, perhaps. Nothing particularly alarming.
You step outside and head towards work. Along the way, you cross a congested intersection, walk past a construction site, and wait beside a busy road.
Somewhere else in the same city, someone is walking through a quiet residential neighbourhood lined with trees.
You both live in the same city. Your weather app shows the same temperature. And the air-quality map gives you roughly the same headline.
But are you actually breathing the same air?
Not necessarily.
Air pollution can vary significantly across a city, sometimes over distances of just a few hundred metres. The difference depends on where emissions occur, how the wind moves, what surrounds a particular location, and how pollution is measured.
The surprising part is that a citywide AQI number can be accurate and still leave out a great deal.
A city isn't one air-quality zone
We tend to think of air pollution geographically.
Delhi is polluted. London has relatively clean air. Los Angeles struggles with smog. A city gets a colour on a map, and we use it to understand the conditions around us.
But cities are not uniform spaces.
A major highway, an industrial facility, a busy commercial district and a residential street each have different sources of pollution. Their surroundings also influence how those emissions disperse.
The US Environmental Protection Agency maintains dedicated near-road monitoring networks because pollution associated with traffic can require specific measurement close to busy roads.
That distinction matters. A reading from a monitoring station several kilometres away may not fully capture conditions immediately beside a heavily trafficked road.
The citywide picture is useful. It simply isn't the same as a street-by-street picture.
The invisible geography of pollution
Some of the most important differences in urban air quality are almost impossible to see on a conventional map.
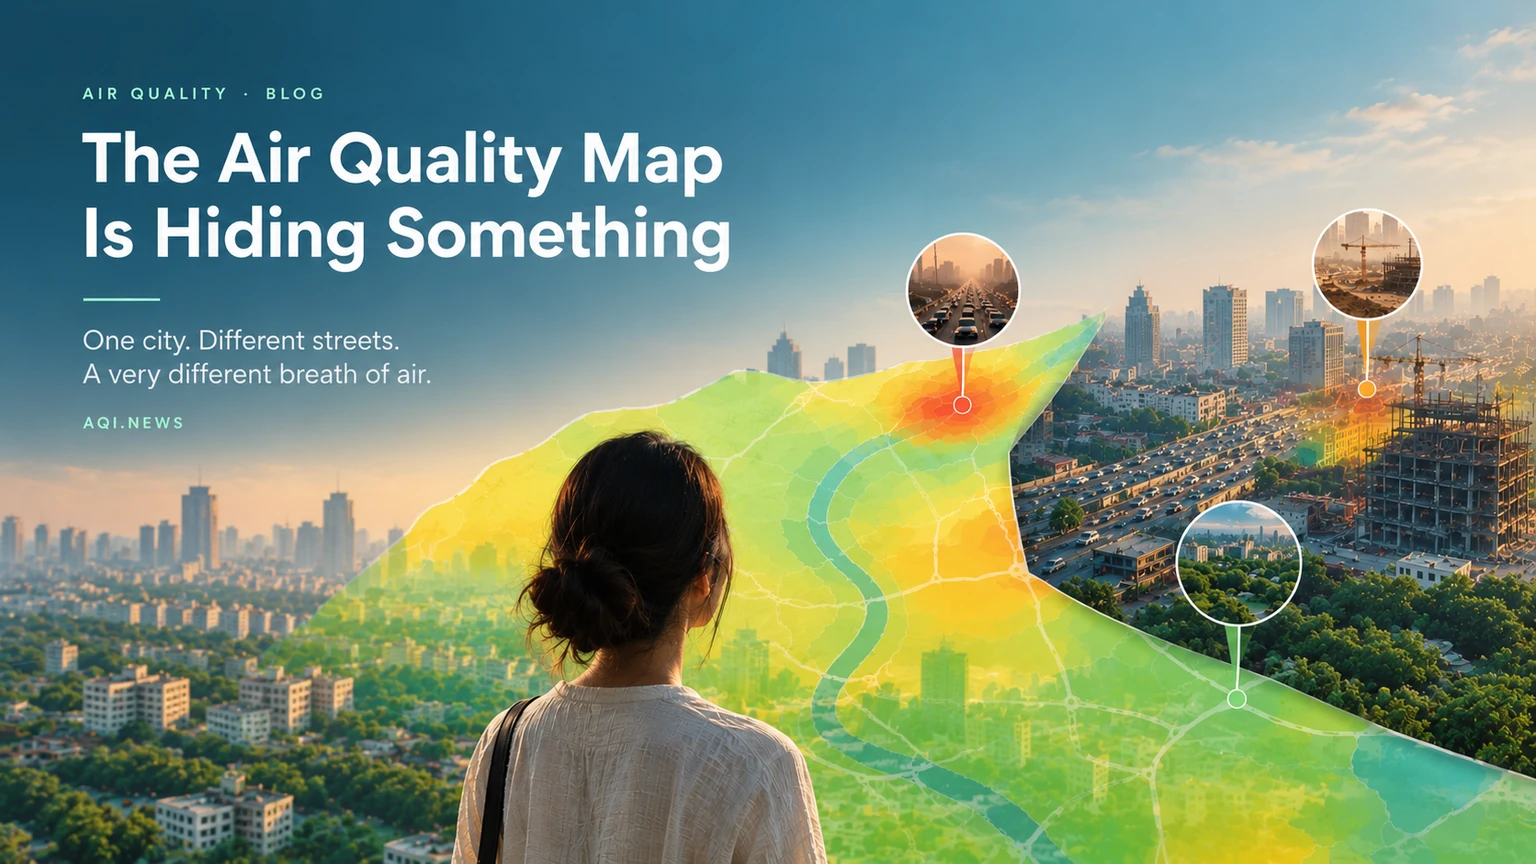
Consider three places within the same city.
Beside a major road. Vehicles release nitrogen oxides and other pollutants. Exhaust, tyre wear, brake wear and resuspended road dust can contribute to local pollution. Concentrations of traffic-related pollutants often decline with distance from major roads, although wind and other conditions affect the pattern.
Near a construction or industrial site. Dust, combustion emissions and industrial processes can add different pollutants to the local mix. The specific impact depends on the activity, controls in place and weather.
Inside a residential neighbourhood. Local emissions may be lower, but the area is not isolated from the rest of the city. Pollution can drift in from nearby roads, commercial areas or more distant sources.
None of these settings guarantees a particular AQI. They illustrate why the location of a measurement matters.
Air pollution has geography of its own – and it doesn't always follow neighbourhood boundaries.
Here's where the map gets complicated
Air-quality maps often combine measurements, estimates or modelled data. These methods can be useful, but they do not all tell you exactly the same thing.
A regulatory monitoring station measures pollutants at a specific location. A satellite observes atmospheric conditions across a broad area, sometimes providing information about pollution-related particles or gases. A forecasting model estimates how pollutants move and change over time. A low-cost sensor measures conditions at its own location, subject to its accuracy and calibration.
Each offers a different view.
The challenge comes when these different views are presented as if they were interchangeable.
A map may display one number for a large area even though the underlying observations are limited to a small number of locations. Another map may use a model to estimate conditions between monitoring stations. Both can be informative, but their uncertainties and spatial resolution differ.
This is why the question isn't simply whether an AQI map is right or wrong.
It's what the map actually measures and what it can reasonably tell you about the place where you are standing.
The same city can look different depending on the pollutant
There is another complication: air pollution isn't one substance.
PM2.5 refers to fine particles with a diameter of 2.5 micrometres or less. These particles can come from combustion, industrial processes, dust-related sources and chemical reactions in the atmosphere.
Nitrogen dioxide, or NO₂, is closely associated with combustion, including road traffic. Ground-level ozone forms through chemical reactions involving other pollutants in sunlight.
These pollutants don't necessarily follow identical patterns.
Traffic-related gases may show pronounced differences close to roads. Fine particulate pollution can be more widely distributed across an urban area, particularly when regional sources and atmospheric chemistry contribute substantially to concentrations.
The World Health Organization's air-quality guidelines address several pollutants separately for a reason: each has its own sources, behaviour and health implications.
A neighbourhood that looks relatively good for one pollutant may not look equally good for another.
And an AQI number that summarises selected pollutants cannot automatically describe every aspect of local air quality.
Why the nearest monitor matters but isn't the whole answer
More monitoring can help reveal differences that would otherwise remain invisible.
A network of well-maintained monitoring stations can show how pollution changes between locations and over time. When combined with satellite observations, validated sensors and atmospheric models, these measurements can produce a more detailed picture of urban exposure.
But more dots on a map don't automatically mean better information.
Sensors need appropriate siting, calibration and quality control. Data must be comparable, and the pollutant being measured must be clearly identified.
Even a monitor right outside your building cannot represent every moment of your personal exposure. You move between streets, workplaces, public transport and indoor spaces. Pollution levels change throughout the day.
Your exposure is a journey, not a pin on a map.
What this means for the way we understand clean air
The difference between a city's average air quality and the air people experience locally is more than a technical detail.
It affects how cities plan roads, place schools, manage construction, regulate industrial activity and decide where additional monitoring is needed.
If a city relies entirely on a handful of measurements, local hotspots may receive less attention than they deserve. If it relies on an average alone, improvements in one area can obscure persistent problems in another.
Better measurement makes it easier to identify where pollution is concentrated and which interventions might help.
It also makes comparisons fairer. A city with a dense monitoring network may appear to have more local pollution hotspots simply because those hotspots are being measured more closely than in a city with sparse monitoring.
The absence of a reading is not proof of clean air.
So, is your city's AQI telling you the truth?
It may be telling you something important – just not everything you want to know.
A citywide AQI is useful for understanding broad conditions. It can help people recognise pollution episodes, compare air quality over time and decide when to take precautions.
But it cannot always tell you whether the air beside your office is worse than the air near your home, whether a nearby road creates a local hotspot, or whether a particular pollutant is elevated in one part of the city.
For that, you need more detailed measurements and a better understanding of what the data represents.
The next time you see an entire city painted one colour on an air-quality map, remember what that colour represents: a summary of a much more complicated atmosphere.
Your city may have one AQI number. Your neighbourhood has an air-quality story of its own.
Your city may have one AQI number. Your neighbourhood has an air-quality story of its own. See the live map and area air scores near you.
Explore the Live AQI Map